
The automated revenue ops nervous system
A three-layer monitoring system that catches problems before they become losses.
Client Snapshot
- Brand: Whiskers n Paws (Premium Pet Food)
- Challenge: Manual, reactive performance monitoring
- Timeline: 4 weeks fixed
- Budget: $9,000 fixed
- Result: Daily automated monitoring, +10.3% revenue growth
What the System Watches
The Problem
Whiskers n Paws had dashboards, so they had visibility. What they did not have was anything that told them when a metric fell below target. Every check was manual, so every response was reactive: by the time a dip was noticed, days of underperformance had already happened.
The team needed something that watched performance daily and raised a flag before a dip became a real problem, not another dashboard that only helped if someone remembered to look at it.
This also had to be built to scale: new metrics would need to be added over time without requiring a full rebuild of the monitoring system each time.
Our Solution
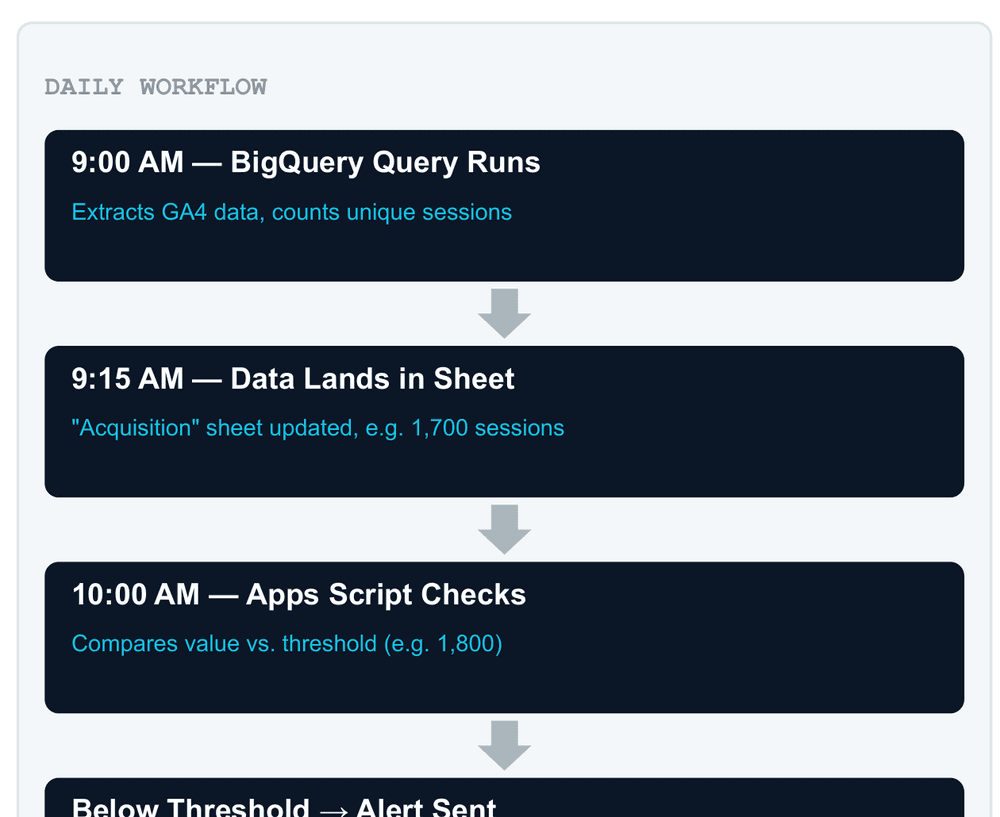
We built a three-layer automated system: BigQuery scheduled queries extract GA4 data every morning at 9:00 AM, counting unique sessions and key metrics. By 9:15 AM, that data lands automatically in a Google Sheet, updating an "Acquisition" tracking sheet with the latest numbers.
At 10:00 AM, an Apps Script check compares the value against a defined threshold. If a metric falls below target, an email alert fires automatically to the Whiskers n Paws team, no manual review required. This threshold-based monitoring replaced periodic manual checks with daily, automatic ones.
On top of the alerting layer, we built a revenue segmentation dashboard using RFM (Recency, Frequency, Monetary) status and LTV-based customer segmentation, giving the team a repeat-customer view, not just a top-line one. The system is built to scale: new metrics get added by extending queries and sheets, no rebuild needed. Within the tracked period, this drove +10.3% revenue growth, +10.3% transaction growth, +5.5% session growth, and +2.7% conversion efficiency (TU to AU).
Automation Stack
- Data Extraction:BigQuery scheduled queries (GA4)
- Data Layer:Google Sheets
- Alerting:Google Apps Script
- Segmentation:RFM-status + LTV-based dashboard
- Notification:Automated email alerts
- Delivery:Full requirements, QA, documentation, handoff
Daily Workflow
1. 9:00 AM — BigQuery Query Runs
Scheduled query extracts GA4 data and counts unique sessions automatically, no manual pull required.
2. 9:15 AM — Data Lands in Sheet
The "Acquisition" tracking sheet updates with the latest numbers, e.g. 1,700 sessions, ready for review.
3. 10:00 AM — Apps Script Checks
Automated comparison of the value against a defined threshold, e.g. 1,800 sessions expected.
4. Below Threshold — Alert Sent
If the metric falls short, an email fires automatically to the Whiskers n Paws team. No dashboard-checking required.
"Not reporting for reporting's sake. Every dashboard here feeds a decision our team actually makes. We know a metric is off before it becomes a real problem, not after."
Operations Lead, Whiskers n Paws
Tired of finding out about problems too late?
Let us build the automated monitoring system that catches the dip before it costs you the quarter.